


Graphs are versatile and dynamic. They are the key to solving the challenges you face in fulfilling your mission.
Using real-world government use cases, this blog series explains how graphs solve a broad range of complex problems that can’t be solved in any other way.
Last week we focused on a case study using Neo4j at Lockheed Martin Space Systems (LMSS).
This week we will outline a case study at NASA.
NASA has been collecting project data since the late 1950s. But accessing that information had been a challenge due to silos between departments and within individual groups, products and programs. NASA needed to break down those silos, which is what it achieved using Neo4j.
A Knowledge Graph of Historical Lessons Learned
Locked in decades of NASA project data is knowledge that holds incredible value to help cut down on project time, enable engineers to identify trends that can prevent disasters and incorporate lessons learned into new projects.
But accessing that information is a challenge due to silos between departments and within individual groups, products and programs. NASA needed to break down those silos, which is exactly what it achieved using Neo4j.
NASA’s Lessons Learned Database is part of the organization’s knowledge management strategy for how it collects, stores and shares information. Engineers use this database to learn about past projects, including any mistakes or successes and what actions were taken.
“We started adding lessons in about 1990, and they went up and down until around 2003, when we had a shuttle disaster that resulted because of a thermal tile malfunction,” explained David Meza, Chief Knowledge Architect at NASA. “If we had had this information beforehand and understood the trends better, we might have been able to prevent the disaster from taking place.”
Previously, the database was made up of less than 1% of the organization’s 20 million documents. With a total of 80,000 employees, the volume, variety and velocity of data was taxing the system. NASA needed a better way for end-users to access this information.
Meza started looking at how to take the documents and convert them into graphs. Because there was a lot of metadata associated within the lessons, Meza correlated the topics based on their self-assigned categories. He could see each lesson with its topic as well as correlations between topics, so he could also see how topics correlated to one another. This allows users to look at trends, which can potentially help NASA engineers prevent disasters like the aforementioned shuttle disaster.
Meza developed a simple graph model to showcase the data to end users. Engineers quickly perform searches and pull the information they need. They also jump from one part of a system or subsystem to another and see the connections between the subsystems. Similarly, project managers use the system to look at information pertaining to various subsystems handled by disparate team members and pull it all together to understand the entire system.
“When you start looking at what kind of documents you have and how you’re able to transform those into actionable knowledge for your end users, you improve your decision making,” said Meza. “Of course, you also leverage lessons from the past, because we tend to make the same mistakes over and over.”
The Lessons Learned database has already generated significant value. “This has saved us at least a year and over $2M in research and development towards our Mission to Mars planning,” said Meza.
Going forward, Meza and his team plan to provide users with the ability to input lessons directly into the database. They’ll also run a text analysis to find text reuse or similarity that allows them to identify documents that are similar topically, but different enough that they might not be caught.
“We’re constantly looking at how to redo our Lessons Learned Database,” Meza said. “One of our problems is that we don’t read the database when we’re having issues. But part of knowledge management is the ability to take that know-what into know-how for the end user, and transmit that knowledge to the next generation.”
Conclusion
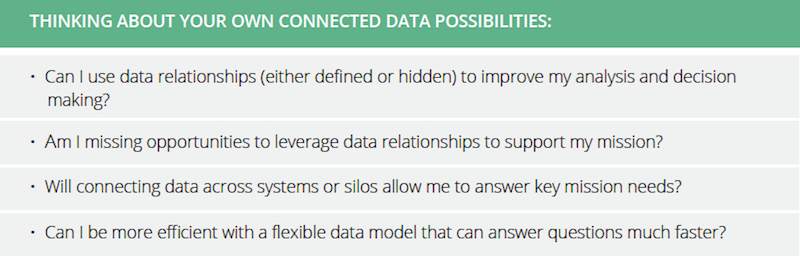
Now that you’ve seen the innovative ways government agencies are using graph databases to fulfill their missions, it’s important to remember that the case studies we’ve covered in this blog series are not all-encompassing.
Graph databases are as versatile as the government agencies that use them. Your use case may differ from those illustrated here, but the impact will be just as empowering. At Neo4j, we help our customers realize the power of graph technology to solve the most challenging and obscure problems, and we’d love to help you consider ways a graph database helps you meet your mission objectives.
Solutions can’t wait:
Witness how leading government agencies are using Neo4j to overcome their toughest challenges with this white paper, Graphs in Government: Fulfilling Your Mission with Neo4j. Click below to get your free copy.
Read the White Paper
Witness how leading government agencies are using Neo4j to overcome their toughest challenges with this white paper, Graphs in Government: Fulfilling Your Mission with Neo4j. Click below to get your free copy.
Read the White Paper


